
Visits Over Time
14 May 2013Categories: Piwik
This “Visits Over Time” graph can show you the number of visits broken down into periods as determined by the time period set. So for example if your time period is set to “day”, the graph will show the latest visits on a day by day basis.
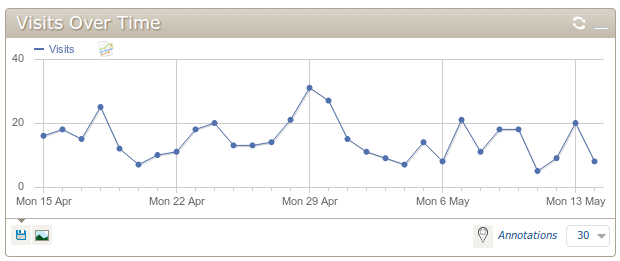
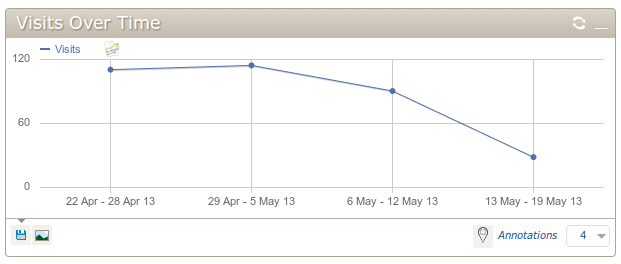
If you were to change the time period to “week”, the graph will aggregate the data and show you the visits on a weekly basis.
Rows to Display
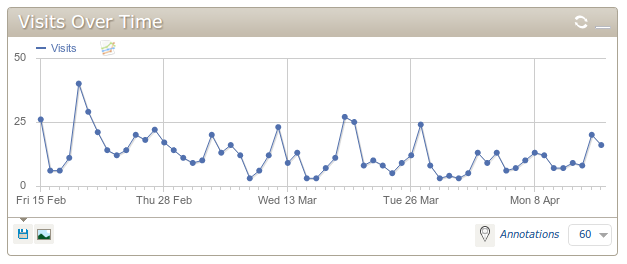
In the bottom left corner, you can change the number of entries to be shown in the graph. This enables you to view more or less data and fine-tune the display as you want. The image below shows the daily data showing 60 days worth of data.
Annotations
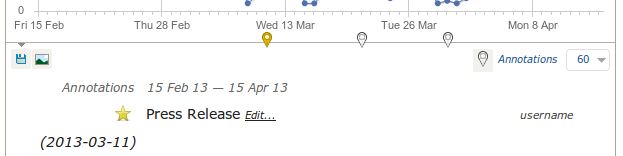
If you have made certain decisions with your business that you believe may affect traffic to your site, you may wish to matk these on the graph so you can easily see when these events happened and what effect the event has ad. You can do this with “annotations”. To create an annotation, click the “annotations” link under the graph.
![]() You will then be presented with a list of annotations which may already exist in the time period you are viewing (if there are any)
You will then be presented with a list of annotations which may already exist in the time period you are viewing (if there are any)

Each annotation is marked underneath the graph and can be identified by highlighting the star next to the annotation text.
If you wish to add a new annotation click the “Create a new annotation link” at the bottom.
![]()
You will be presented with a field to enter in the text for the annotation. You can also select the date of the new annotation